Welcome to our Stata guide! Whether you’re an advanced data analyst or just starting, learning Stata is key. It helps with efficient and precise data analysis. In this piece, we’ll share our top 10 tips. These will make your Stata data work smoother and more effective.
But, before we get into tips, here’s a quick story. Imagine you have a project with a tight deadline. You need to analyze a big set of data for insights. Using Stata, you start but find it tough to handle the data clearly. Days pass as you struggle with the complicated parts.

That’s where our tips come to help. They aim to make Stata data work less of a puzzle. We want to make your analysis work more smoothly. From knowing data types to handling data better, we’ve got you.
Key Takeaways:
- Master essential Stata tips to enhance your data analysis skills.
- Understand the data types and structures in Stata.
- Learn basic data manipulation commands for efficient data handling.
- Explore Stata programming for automating complex tasks.
- Optimize your data analysis using advanced Stata commands and techniques.
Understanding Stata Data Types and Structures
In Stata, knowing the right data types is key to good analysis. It helps you work with data more accurately. Stata uses different types like numeric, string, date, and categorical data for varied purposes.
- Numeric data: shows numbers for things like age or income.
- String data: includes text, like names and addresses.
- Date data: is for time-based details, important for temporal studies.
- Categorical data: sorts items into groups, like gender or education levels.
Each type plays its own role in understanding data. For example, you can do math with numbers. And, to work with text data, you need different tools.
In Stata, datasets are where we start our work. They hold variables, observations, and metadata. Variables are like the columns, holding the dataset’s information. Observations are the rows, each one showing a unique view. Metadata adds extra details to variables and observations, enriching the data’s context.
Now, let’s explore a Stata dataset’s layout:
Variable Type Label age Numeric Respondent’s age gender Categorical Respondent’s gender income Numeric Respondent’s income education Categorical Respondent’s education level date_registered Date Date of registration
This table shows variables like age, gender, income, and education. It also shows their types and labels for better understanding.
Getting to know Stata’s data structure is important. It prepares you to work with and dig into your datasets. This knowledge is like a first step to using Stata for in-depth data analysis.
Mastering Basic Data Manipulation Commands
In Stata, knowing how to handle data well is key for successful study. You need to learn the main commands for data work. This lets you make and replace variables, adjust data where needed, and use loops and macros the right way.
Generating and Replacing Variables
The generate command is for making new variables from the old ones. It lets you add new data or do math or create flags for your study. Replace changes the data in existing variables. This is handy for fixing errors, updating data, or working with specific parts of your data.
Conditional Data Handling
Stata is great for looking at specific parts of your data with the if command. It helps you focus on only what you need for your study. Logic operators like “==” or “>” help you make these selections based on your study’s needs.
Efficient Use of Loops and Macros
Loops and macros help you work more quickly in Stata. Loops let you do the same thing on a lot of data without typing it all out again. Macros help keep your code neat and let you reuse parts of it.
| Command | Description |
|---|---|
| foreach | Iterates over a list of items or variables and performs a set of commands |
| forvalues | Iterates over a range of values and executes a set of commands |
| local and global macros | Store and manipulate values or code snippets for later use |
Learning these basic commands lets you manage and study your data well in Stata. Making and changing variables is easier. You can filter data for what you need. And using loops and macros will save you time and make your work smoother.
Getting Started with Stata Programming
Stata programming is a strong tool for making custom commands. It lets you automate hard tasks. In this section, we will learn the basics.
Stata allows you to work with data in a better way. By making custom commands, you can reuse code. This saves time and makes your work easier. Stata has many tools for data analysis.
The main part of Stata programming is using do-files. Do-files have Stata commands that you can write and save. They help you keep track of your work and share it with others. You can also make your code easier to understand by organizing it well and adding comments.
When you write in Stata, always follow the right rules. This makes sure your commands work properly. Stata has rules on how to structure your commands. By sticking to these rules, you can avoid mistakes.
In short, Stata programming is very useful. It helps you do things faster and in your own way. Knowing Stata syntax and how to use do-files is the key to making great programs. These programs will make your data analysis better.

Top 10 Stata Tips for Optimized Data Analysis
In this part, we’ll dive into advanced tips for better data analysis in Stata. These pointers boost how well and accurately you work on your data. We’ll look at using indicator variables, setting base categories, and dealing with continuous variables.
Using Indicator Variables for Regression
Indicator variables, or dummy variables, shine in regression tasks. They turn category variables into binary ones for models. This way, you can understand how different categories affect your results. It’s a key tool for multiple category variables.
Setting Base Categories in Categorical Analysis
In Stata, picking a base category is crucial for comparing others. Choosing it wisely simplifies result analysis. It gives you clearer insights into the links between variables and outcomes.
Working with Continuous Variables Interactions
Some variable relationships are not just straight or simple. For these, try handling continuous variable interactions. Adding these terms in models shows how variables’ effects change with others. It helps deeply understand complex connections.
| Tips | Description |
|---|---|
| 1 | Use indicator variables in regression analysis for categorical variables |
| 2 | Set a base category when conducting categorical analysis |
| 3 | Explore interactions between continuous variables for deeper insights |
| 4 | Take advantage of Stata’s regression commands and options |
| 5 | Consider the assumptions of regression analysis before interpreting results |
| 6 | Utilize Stata’s built-in functions and operators for data transformations |
| 7 | Visualize regression results using Stata’s graphing capabilities |
| 8 | Perform robust regression analysis to account for outliers |
| 9 | Check for multicollinearity among independent variables to ensure model stability |
| 10 | Document and replicate your analysis using Stata’s log files and do-files |
Effective Data Visualization with Stata Graphing
Data visualization is key to understanding your data. In Stata, there are many powerful graphing tools. They help you create charts and graphs that show what your data means clearly.
Stata lets you customize your graphs easily. You can highlight patterns and relationships in your data. Whether you want bar charts, line graphs, or scatter plots, Stata has the tools you need.
To get better at visualizing data with Stata, we’ll look at different graphing techniques. We’ll also see some examples of Stata’s graphing commands.
- Create interactive dashboards and reports: With Stata, you can make dynamic visuals. These are interactive and engaging. They can filter data or let users explore more information in detail.
- Combine multiple graphs into one: You can put several graphs together in Stata. This helps you compare different parts of your data easily and clearly.
- Modify graph aesthetics: Stata lets you change how your graphs look. You can pick colors, label things, and adjust scales. This makes sure your graphs say what you want them to.
- Create publication-ready visuals: Stata helps you make visuals that are ready for sharing or printing. You can save your graphs in different formats, like PDF or PNG. This makes them good for reports, articles, and presentations.
By learning Stata’s graphing features, you can turn your data into visual stories. These stories help people understand and remember your analysis better.
| Graph Type | Command | Example |
|---|---|---|
| Bar chart | graph bar | 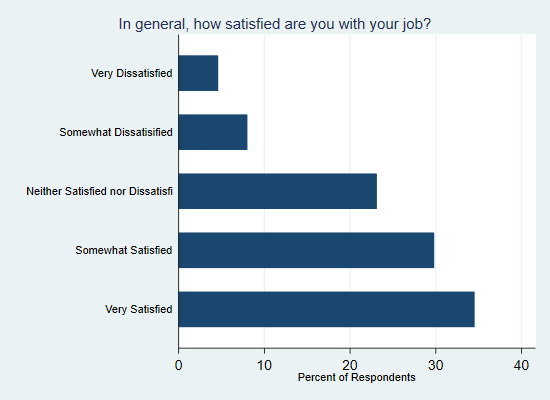 |
| Line graph | twoway line |  |
| Scatter plot | twoway scatter |  |
| Area plot | twoway area |  |
These are just a few examples of what Stata’s graphing tools can do. Try out different commands and options. See how much you can do with Stata for visualizing data.
Advanced Stata Commands for Complex Analysis
In this section, we’ll explore advanced Stata commands. These are made for in-depth data analysis. You’ll learn to handle complex tasks and understand your data better.
Stata has many tools for in-depth research. You can do more with your data by using these commands. They help you make smarter decisions from your analysis findings.
Stata is great for big data, statistics, and economics. It lets you dig into your data’s details. This helps find key insights and predict outcomes with more accuracy.
These Stata commands cover many areas like econometrics and time series. They’re for intricate data analysis. So, they’re perfect for complete research.
With Stata, you can do a lot. You can test ideas, handle missing data, and complex surveys with ease. These tools make your study results correct and dependable.
Also, Stata comes with lots of help and documents. It has a big user community ready to assist. You can even use additional commands and packages to do more.
Stata’s tools help you dive deep into data. They let you understand complex info. By using these tools, your analysis gets better and more insightful.
Best Practices for Time Series Analysis in Stata
Time series is a strong tool for looking at data over time. Stata is great for this analysis. It’s popular with researchers and analysts for its features.
Utilizing Time-Series Operators for Data Transformation
In Stata, getting data ready is key. Use time-series operators to change the data right. This step prepares it for more detailed analysis.
Operators like l. and D. help with finding past and changes in data. These let you make new data that shows how the data trends. This is helpful for making predictions.
“By using time-series operators, we turn complex data into clear trends. This helps us predict and understand the data better.”
Modeling Approaches for Autoregressive Processes
Autoregressive models are key in time series. Stata has many ways for modeling these. This helps with detailed analysis and accurate predictions.
The ARIMA model is a favorite for its mix of components. It deals with trends, seasonality, and randomness. With ARIMA, you can forecast data and understand its details.
Stata also works with ARCH and VAR models. ARCH is good for when data shows a pattern of changes. VAR is useful with many data variables.
“Using autoregressive modeling methods, we dive deeper into data dynamics. This helps with more accurate predictions and smarter decisions.”
Stata Time Series Analysis Functions
| Function | Description |
|---|---|
| tsset | Sets the time and data to be time series |
| arima | Fits an ARIMA model on the data |
| arch | Looks at ARCH or GARCH for special data patterns |
| var | Finds patterns across multiple data series with VAR |
| predict | Tells you future values based on the model |
| tseries | Has more tools for working with time series data |
Using these tools well helps you deeply analyze time series in Stata. You’ll get key insights from your data.
Implementing Survey Data Techniques in Stata
Survey data often comes with complex designs. These need special techniques for analysis. In Stata, there are special commands for studying survey data. Learning and using these tools in Stata ensures your survey data analysis is solid.
“Stata gives researchers tools to tackle complex survey data. It considers survey designs with stratification, clustering, and weighting. With Stata’s survey commands, researchers can rightly estimate findings and make valid inferences from survey data.”
Carrying out survey data analysis in Stata includes key steps:
- Importing survey data into Stata.
- Defining the survey design: You use Stata’s commands to point out the primary sampling unit, strata, and weights.
- Using the right estimation commands: For figuring out means, regression coefficients, and other survey values, Stata has commands.
- Understanding survey estimates: It’s key to making sure you draw correct insights from your analysis.
Stata also helps with managing missing data, working out design effects, and running tests that consider survey designs. These tools help make your analysis match the real survey data’s complexity.
Using survey techniques in Stata lets researchers get solid results. Whether in social sciences or market research, Stata has the tools for detailed survey analysis. Its survey commands are ready to meet your analysis needs.
| Benefits of Using Stata for Survey Data Analysis |
|---|
| 1. Flexible survey designs: Stata can handle many kinds of surveys, from stratified to multistage. |
| 2. Accessible survey estimation: Stata offers commands for precise and easy estimation of survey data. |
| 3. Correct standard errors: Stata’s survey commands make sure the standard errors fit the survey design fairly. |
| 4. Advanced statistical tests: Stata has special tests for analyzing survey data. |
| 5. Integrated data management: Stata’s data tools work well with survey analysis for smooth data prep. |
By using Stata’s survey analysis features, researchers can analyze survey data with confidence. Stata’s special commands for surveys make it easier to explore and understand survey data’s complexities.
Enhancing Modeling with Stata’s Postestimation Tools
In Stata, postestimation tools help us understand and check our models better. They work after we’ve made a model, diving deeper into its results. We’re going to look at two key parts of these tools in Stata:
Interpreting Output with Margins and Predictions
To understand our model better, we use postestimation tools like margins and predictions. The margins command shows us how independent variables affect the outcome. This way, we dig into what the model predicts, learning more about how variables are linked. The predictions command helps us see the model’s accuracy with predicted values for certain data points.
Diagnostics: Testing Assumptions and Model Fit
It’s important to check our model’s assumptions and fit to trust the results. Stata has tools for running diagnostic tests. These let us see if our model meets key assumptions, like linearity and distribution shapes, and if its fit is good. Tools like the vif command look for multicollinearity and the hettest command tests if variances are the same. Knowing and using these tests well can point out model problems, guiding us to fix them.
Next, we’ll dive into tips and tricks for Stata beginners. It will give a strong start for using the software well.
Stata for Beginners: Tips and Tricks for a Solid Start
If you’re new to Stata and looking to get started, you’re in the right place. Starting a new software can be tough, but we’re here to make it easier. With our tips and tricks, you’ll be a Stata pro in no time.
First, get to know the Stata interface. It’s important to understand how everything looks and works. This will make using Stata much easier for you.
Next is learning the basics commands in Stata. These are the first steps in your data analysis journey. Start with loading and saving data. Then, move on to checking out and summarizing your data. Knowing these basics will help you get started well in Stata.
As you learn more, Stata’s help system is a big support. The Stata documentation is detailed and easy to understand. You can use the help command to find information on any topic.
Being efficient is crucial. Stata has tools to make your work quicker. Learn about do-files and log files. With do-files, you can run a series of commands again. Log files keep a record of your work. These tools will help you work faster and better.
Data management is also critical in Stata. You need to know how to change and use your data. Spend time learning common data commands like generate and replace. This will make your analysis more precise and insightful.
Don’t forget about the Stata community. There are many users and online forums ready to help you. You can ask questions and share your ideas. Joining these discussions will help you learn more about using Stata.
With these tips and tricks, you’re ready to dive into Stata. Remember, the more you practice, the better you’ll get. So, start using Stata and enjoy analyzing your data!

Conclusion
We’ve gone over important Stata tips that will boost your data skills. In this article, we talked about understanding Stata’s data types and how they are organized. We also looked at basic commands for changing or finding information in your data.
By using these tips in Stata, you will make working with data faster. You can also automate tasks that you do over and over. Plus, you will dig deeper into what your data shows.
We hope you found this article helpful. Stata is great for working with data, and these tips will help you use it better. If you want to learn more, check out Stata seminars on interactions. They offer advanced learning and practical exercises.